Each tool has its strengths, and system administrators often combine them to get a comprehensive view of their systems.
Table of Contents
The ps Command
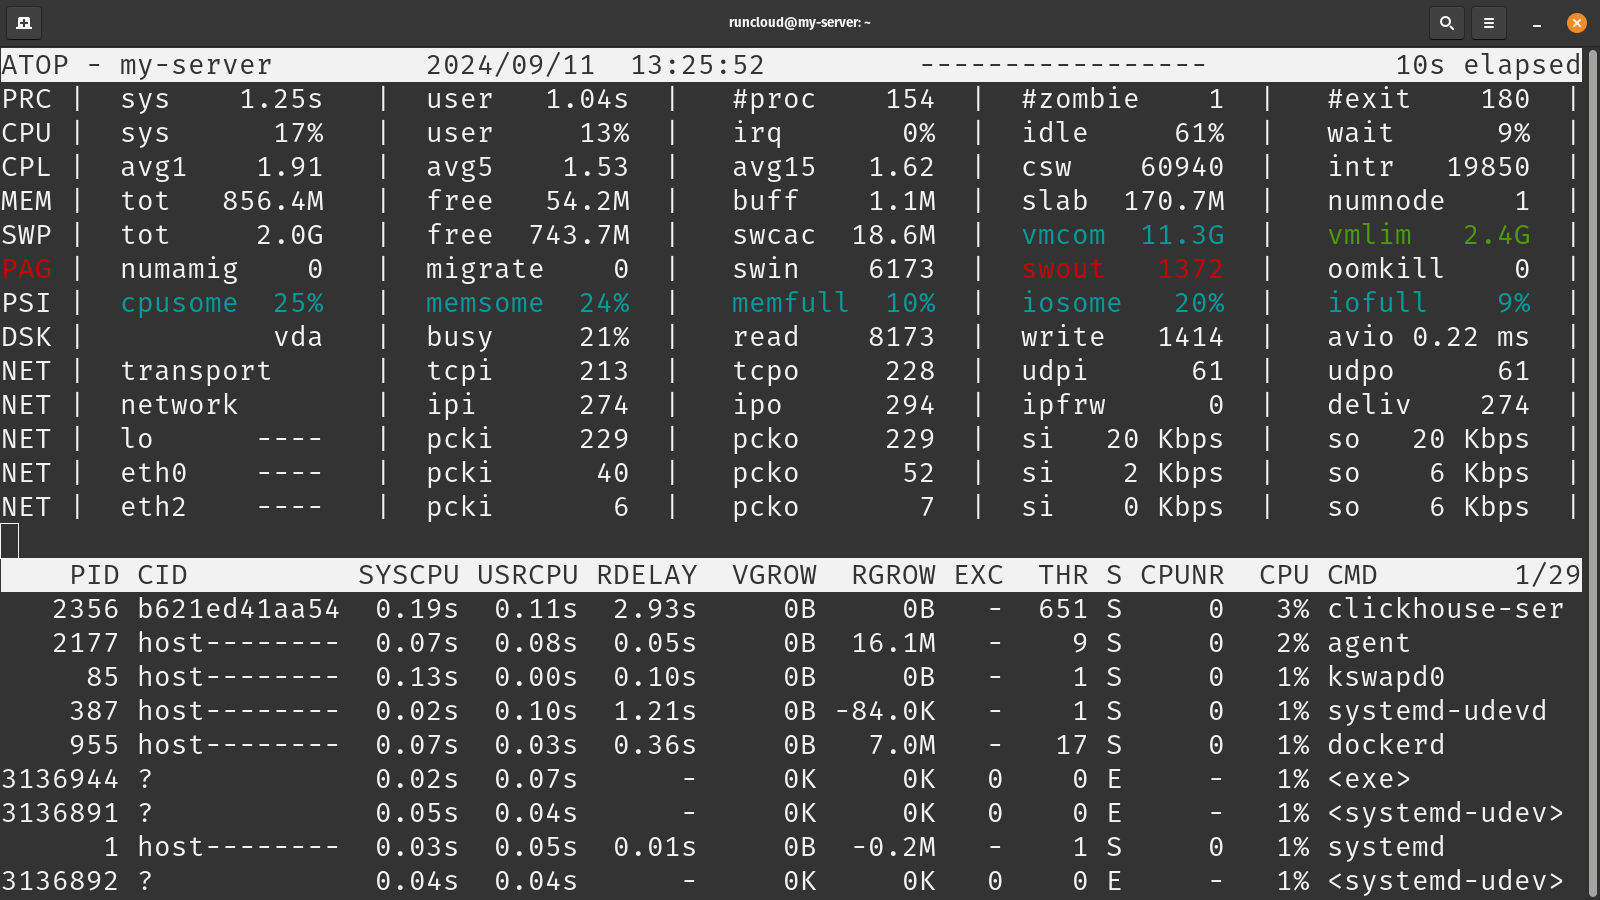
Suggested read: Introduction to Bash For Loops: A Beginner’s Guide You can run the top command by executing the following in your terminal:atop is a powerful tool, and you can enjoy its powers once you learn to navigate it. Here’s a list of some of the basic commands that you can try to get started with atop:
- The processes associated with the current terminal session
- The process ID (PID)
- The terminal type (TTY)
- The CPU time used
- The command name
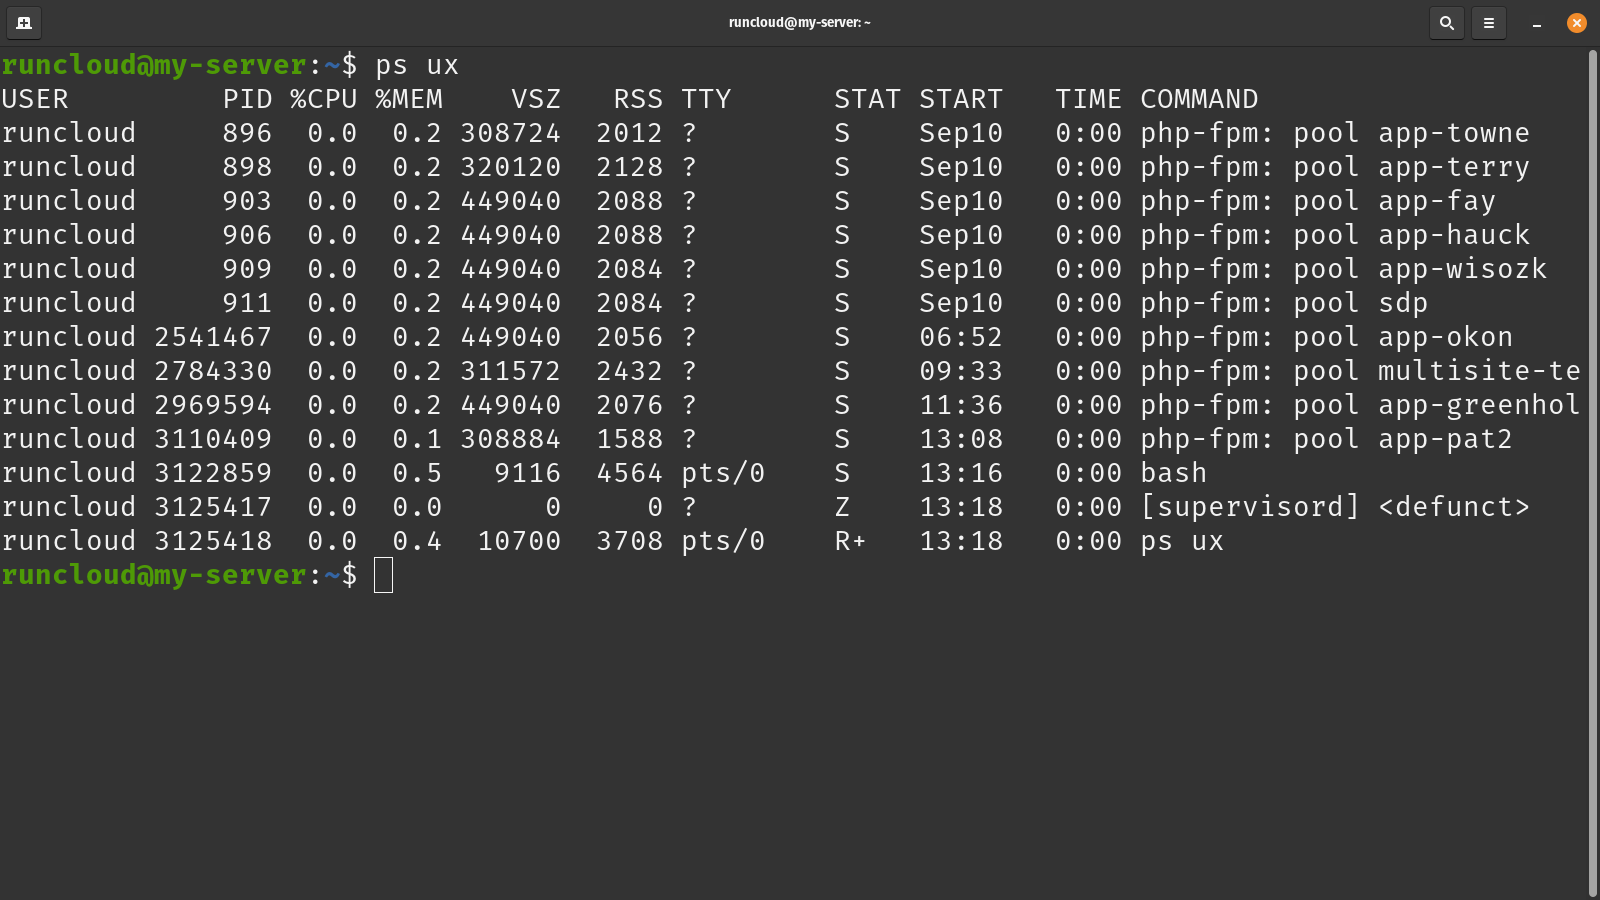
The ps command shows useful information, but you can use advanced options and flags to change its default behavior. Here’s a list of some of the possible options:
Common Options and Flags
atop (Advanced Top) is a powerful, interactive monitor that allows users to view the load on a Linux system. It shows the status of the most critical hardware resources (CPU, memory, disk, and network) at a system level. It has several unique features that set it apart from other monitoring tools:
- -e or -A: Show all processes
- -f: Full format listing, providing more details
- -u username: Show processes for a specific user
- -p pid: Show information for a specific process ID
- –sort=[+|-]key: Sort the output. Use + for ascending, – for descending
- -o format: Customize the output format
Examples of ps Command Usage
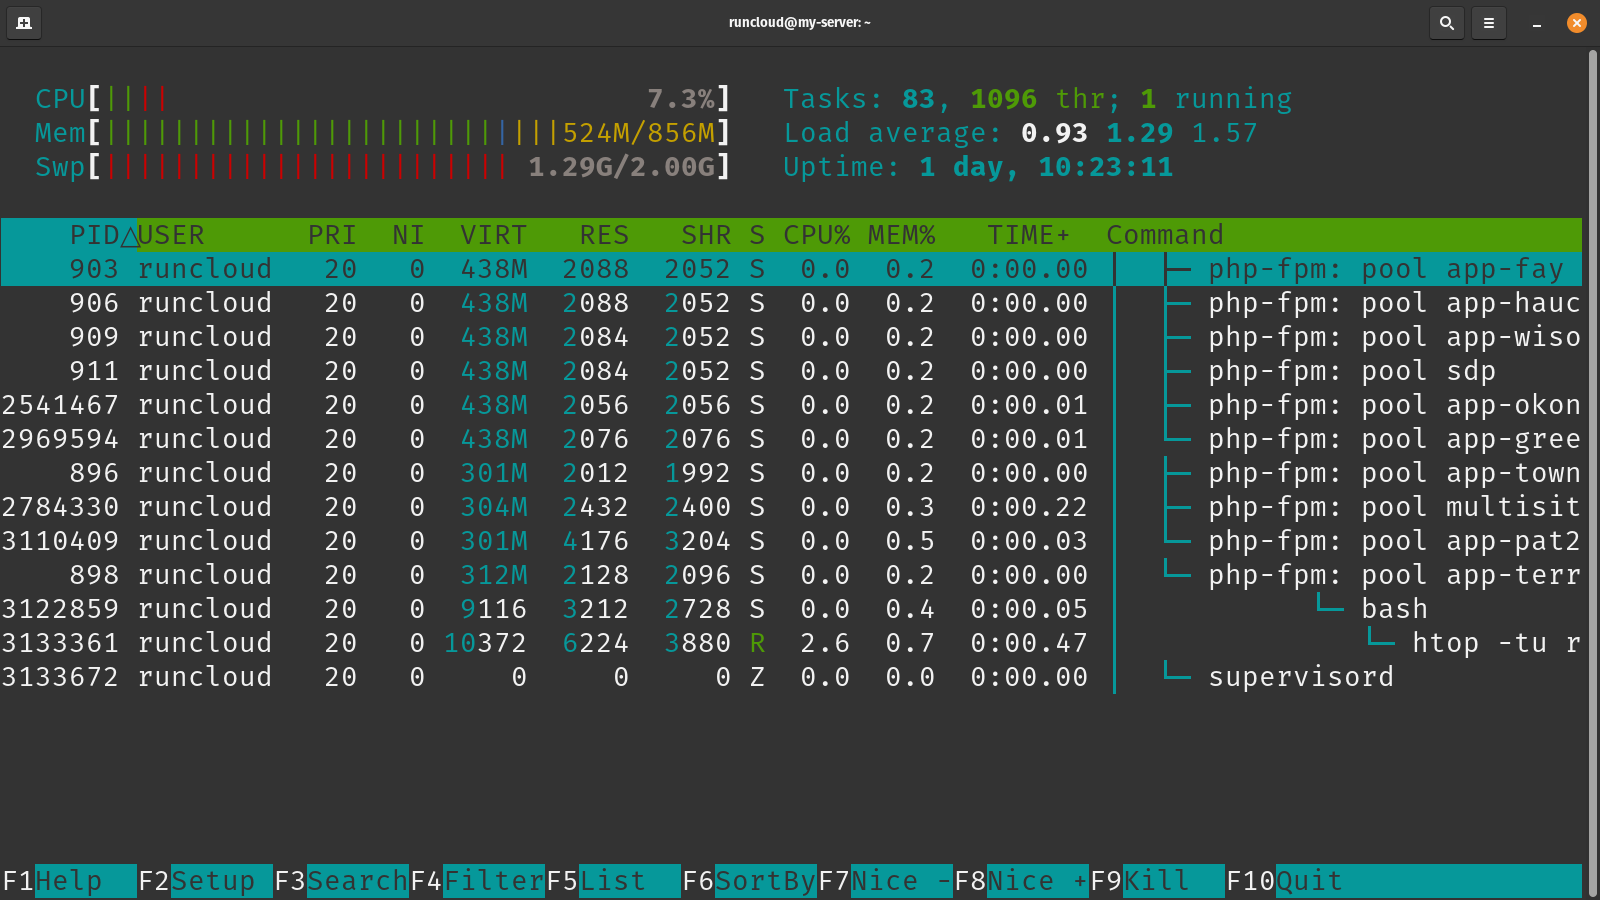
The htop interface can be overwhelming at first glance, but once you learn to navigate it, you’ll get detailed information about your system with only a few key presses. Let’s see some keyboard actions and what they do on htop interface:
- List all processes:
ps -e - Full format listing of all processes:
ps -ef - Show processes for a specific user:
ps -u username - Display processes sorted by CPU usage:
ps -eo pid,ppid, cmd,%cpu,%mem --sort=-%cpu - Display only the process IDs:
ps -eo pid
Suggested read: How to Find Most Used Disk Space Directories and Files in Linux
The top Command
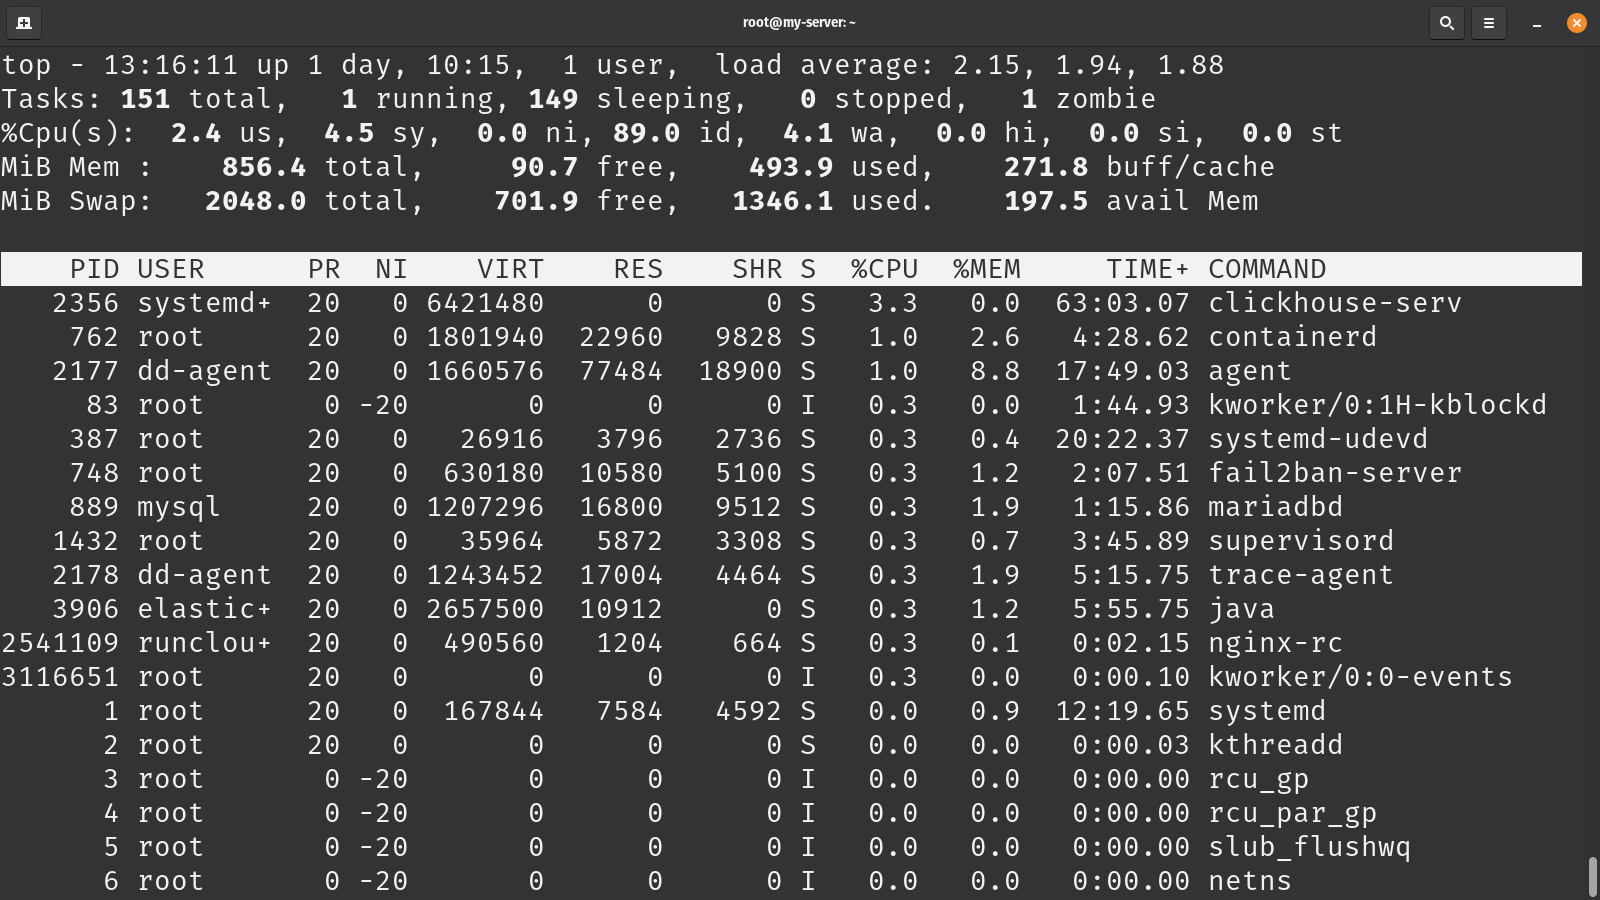
The top interface is divided into two main sections presenting different information. Here’s is a quick overview of both sections:By the end of this article, you will be able to use ps, top, htop, and atop, which are some of the most powerful command-line utilities that provide deep insights into system behavior.Suggested read: Best 9 htop Alternatives for Linux, Mac & Windows in 2024
Understanding the top Interface
The ps command is very flexible. You can mix and match the above flags to produce the desired output. For example:
- Summary Area (top half):
- System time and uptime
- Number of users logged in
- Load average (1, 5, and 15-minute averages)
- Tasks summary (total, running, sleeping, stopped, zombie)
- CPU usage breakdown (user, system, idle, etc.)
- Memory usage (total, free, used, buffers/cache)
- Swap usage
- Process List (bottom half):
- PID: Process ID
- USER: User who owns the process
- PR: Priority
- NI: Nice value
- VIRT: Virtual memory used
- RES: Resident memory used
- SHR: Shared memory
- S: Process status
- %CPU: CPU usage
- %MEM: Memory usage
- TIME+: Total CPU time
- COMMAND: Command name
Top Command Flags and Options
Suggested read: Mastering the Echo Command in Linux (with Practical Examples)
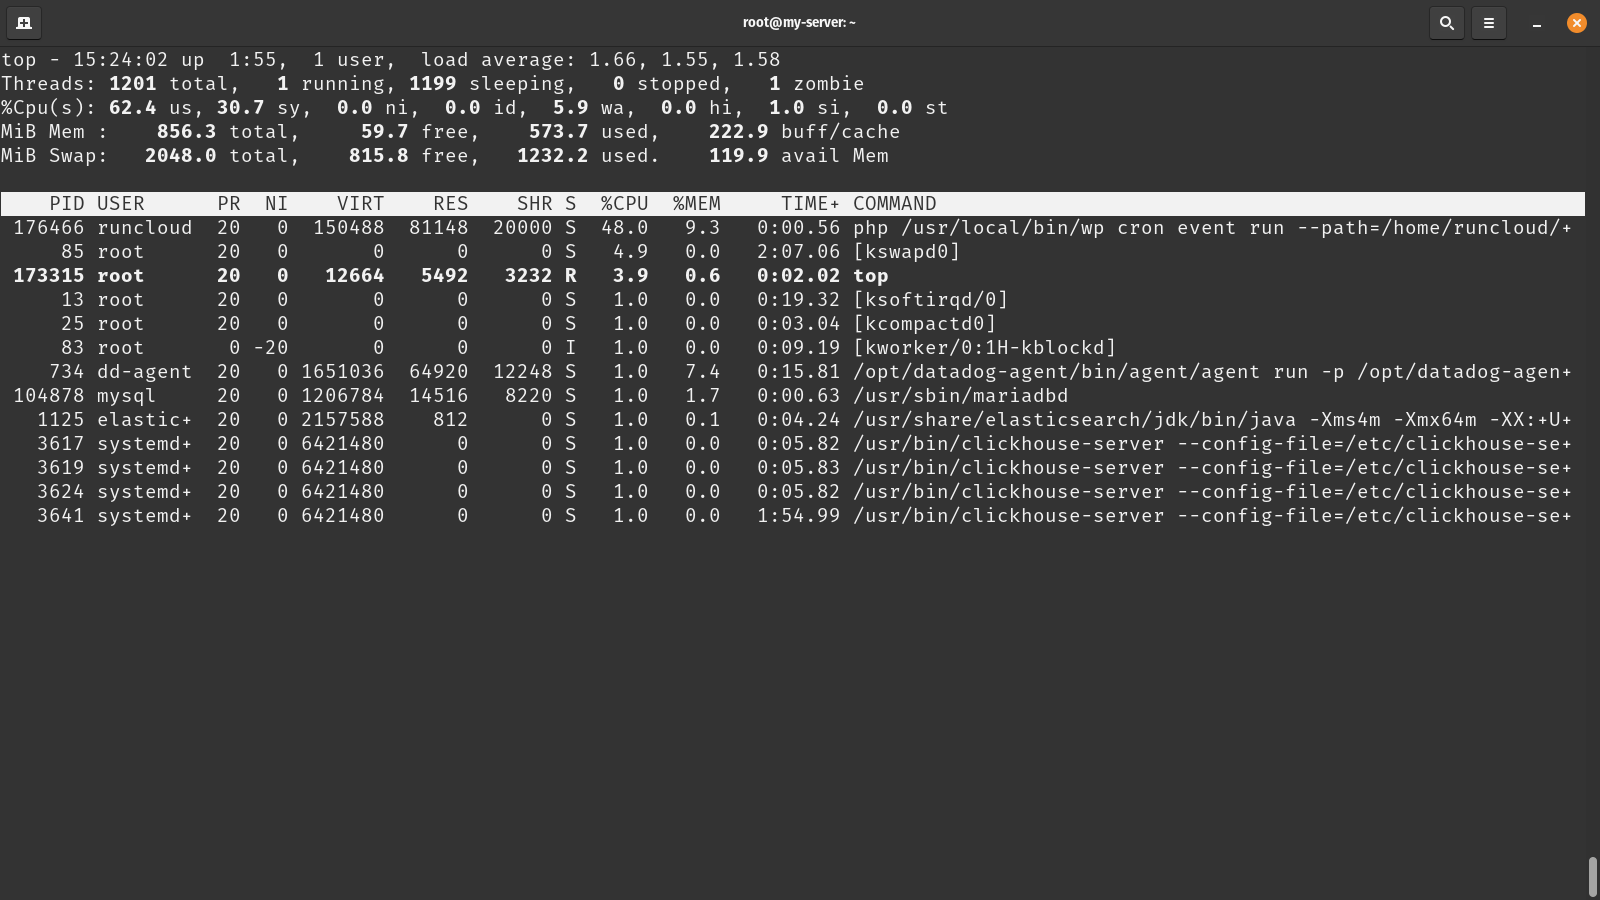
-b(Batch mode): This runs top in batch mode, which is useful for sending output to other programs or a file.-n(Number of iterations): This parameter specifies the number of iterations before the top exits. It is useful in scripts or when capturing a specific number of samples.-p(Monitor specific PIDs): Shows only the processes with the specified PIDs.-u(Show specific user’s processes): Displays only the processes the specified user owns.-H(Show threads): Shows individual threads instead of processes.-o(Sort field): Sorts the process list by a specific field (e.g., CPU usage, memory usage). For example, top -o %CPU- –
i(Ignore idle processes): Does not display idle or zombie processes. -c(Show command line): Displays the full command line for each process instead of just the command name.-d(Delay time): Sets the delay between updates (in seconds). The default is 3.0 seconds.
This post has covered some of the most common system monitoring tools for Linux servers. While command-line tools provide powerful and flexible monitoring capabilities, they still require a certain level of expertise to use effectively. Moreover, if you manage multiple servers or want a more user-friendly interface, these tools might not be enough for you.htop is an interactive process viewer for Unix systems, designed as an enhanced alternative to the top command. It offers several advantages over other process viewers:
The htop Command
top -b -n 5 -o %MEM -u root > top_output.txt
The top command also offers various flags and options that allow you to customize its behavior and output. Here are some of the most useful ones:sudo apt update && sudo apt install htop
Suggested read: Pipes vs Xargs: Which One To Use When Writing Bash Scripts In Linux
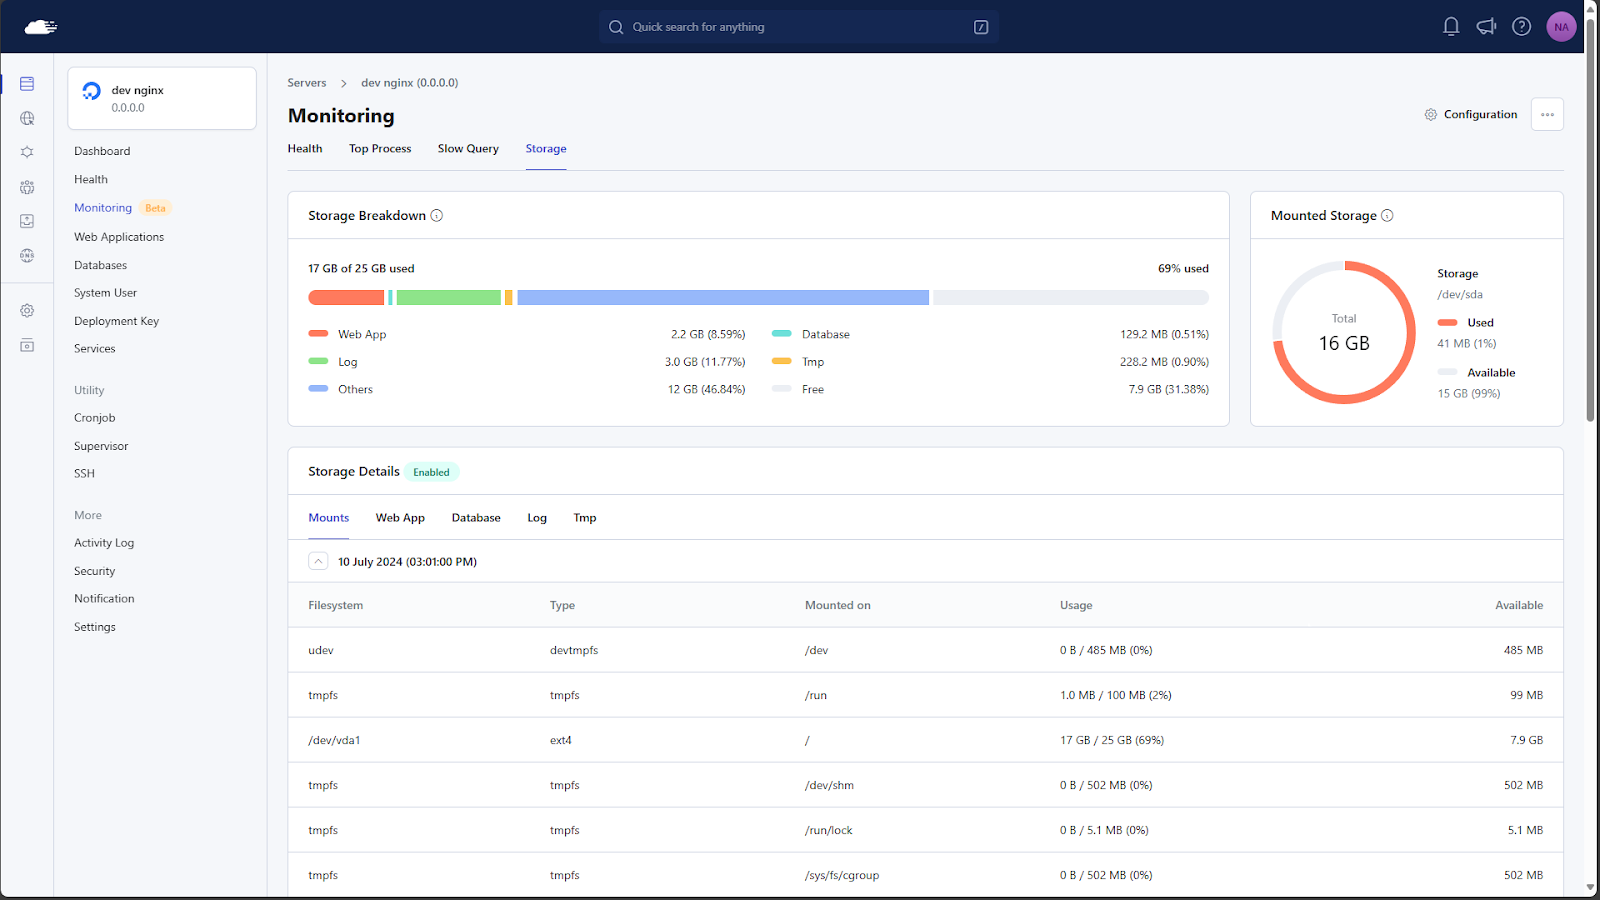
Here’s how RunCloud enhances your monitoring experience:
- Header (top) section shows system-wide stats and meters
- CPU usage (per-core and overall)
- Memory usage
- Swap usage
- Tasks, load average, uptime
- Process list (bottom) shows detailed information about each process
ps [options]
htop is typically not pre-installed on most systems. Run the following command with the necessary permissions on your Ubuntu/Debian systems to install it:
Customizing htop display and settings
The top command is a real-time system monitoring tool that provides a dynamic, interactive view of a Linux system’s running processes. It displays system summary information and a list of processes or threads currently managed by the Linux kernel.
htop -t: Start in tree viewhtop -u username: Show only processes of a specific userhtop -p PID1,PID2,...: Show only specified processes
The atop Command
The ps command is short for “process status”. It is a fundamental tool in Linux for viewing information about active processes.
- Persistent logging: atop can write snapshots to a log file for long-term analysis.
- Resource-specific views: It has dedicated screens for CPU, memory, disk, and network details.
- Cumulative reporting: It can show resource consumption since the system boot.
- Process accounting: It can also track short-lived processes that might be missed by interval sampling.
Ready to simplify your server monitoring and management? Sign up for RunCloud today!
Installing atop
The htop interface is divided into two main sections:This is where RunCloud comes into play. RunCloud’s dashboard simplifies server monitoring and management, making it accessible even to those without deep Linux expertise.
sudo apt update && sudo apt install atop
top
atop is not pre-installed on most systems. You can run the following command to install it on most Ubuntu/Debian distributions:
Final Thoughts: Simplifying System Monitoring with RunCloud
The basic syntax for using the ps command is:These flags can be combined for more specific outputs. For example, the following command will run top in batch mode for five iterations, sorts by memory usage, shows only the root’s processes, and sends the output to a file:Suggested read: How to Copy Files in Linux and Overwrite without Confirmation
- Centralized Monitoring: Instead of logging into each server individually, you can monitor all your servers from a single dashboard.
- User-Friendly Interface: RunCloud presents complex system information in an easy-to-understand graphical interface, eliminating the need to interpret command-line output.
- Disk Usage Monitoring: Easily track disk usage across all your servers, helping you prevent disk space issues before they become critical.
- Slow Script Detection: RunCloud can identify slow-running scripts, a feature that typically requires setting up additional monitoring tools on your servers.
- Alerts and Notifications: Set up custom alerts for various metrics to notify you immediately of any issues.
To view the atop interface, simply type atop in the terminal. This will open up a new screen where you will see the following information:


